A Rounding Bottom is a Bullish Classical Chart Pattern that is identified by a series of price movements that graphically form the shape of a “U”. A Rounding bottom is found at the end of extended downward trends and is typically used as a reversal pattern to indicate a bullish trend reversal when the breakout happens to the upside from the pattern.
A Rounding Bottoms are typically formed in Weekly and higher timeframes and can take a long time to form.
A Rounding Bottom looks similar to the cup and handle pattern, but does not experience the temporary downward trend of the “handle” portion. A stock usually goes down during the initial part of the Rounding Bottom due to more supply compared to demand. Once buyers enter the market at a lower price, it increases demand for the stock, and the uptrend is started. After the Rounding Bottom is complete, the stock breaks out and continues in its new upward trend.
As usual, just like for any other Classical Pattern, volume plays an important role in the formation of the Rounding Bottom pattern. During the beginning downtrend of a Rounding Bottom, ideally, the volume will be higher and above average, and it will decline as it makes the bottom. Volume should ideally again increase as the uptrend starts and then a high volume breakout from the Rounding Bottom completes the reversal and confirms the start of the uptrend.
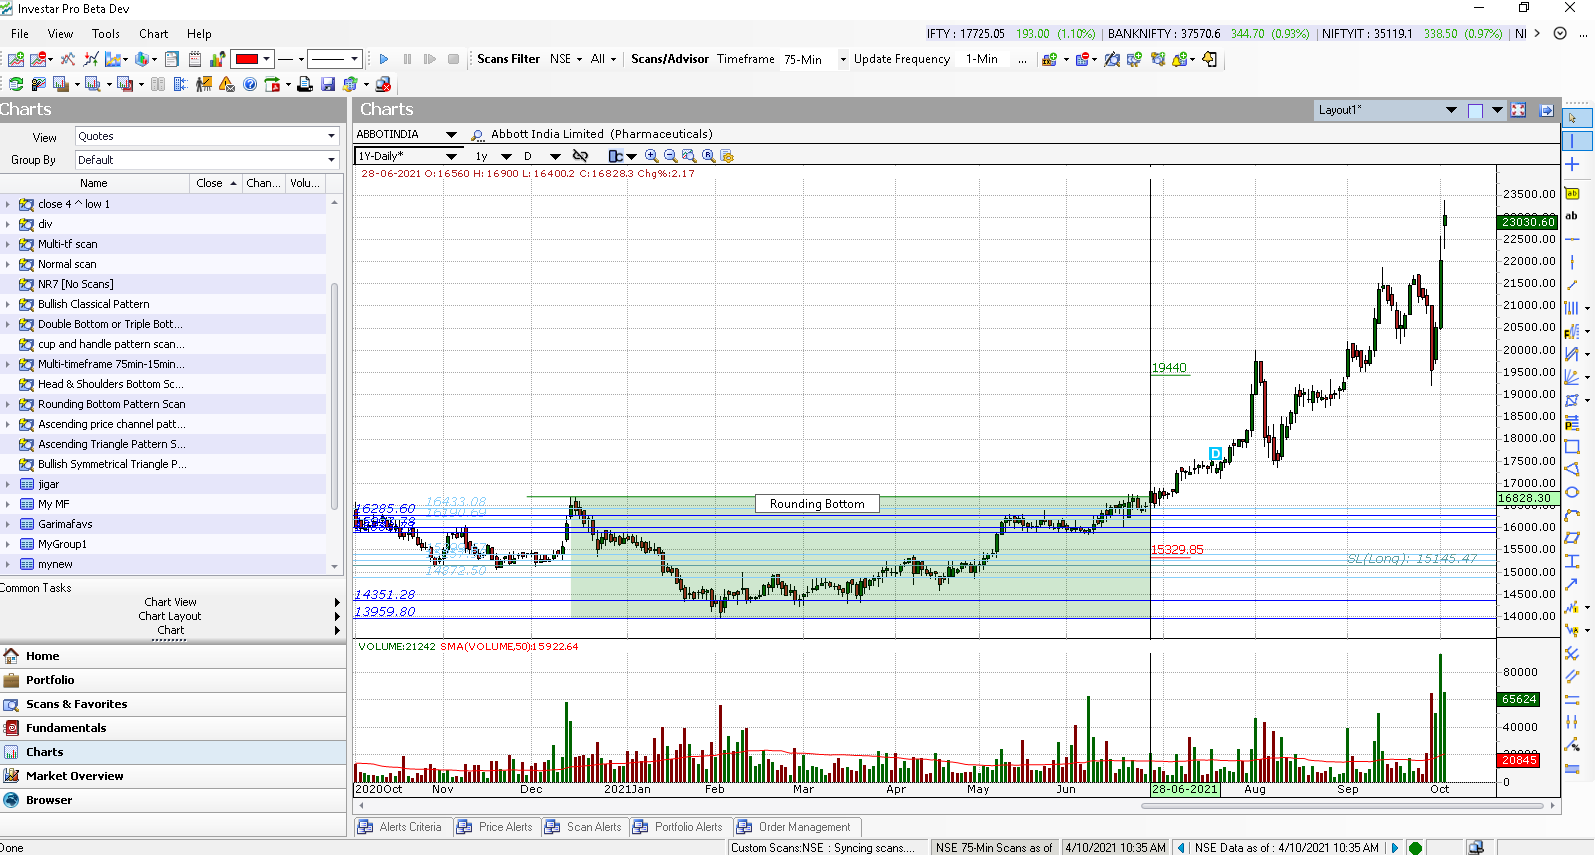
Rounding Bottom Chart Example
Investar has an Auto-Classical Pattern feature which automatically detects the Rounding Bottom (if enabled) and shades the area covering the Rounding Bottom as shown in the image below.
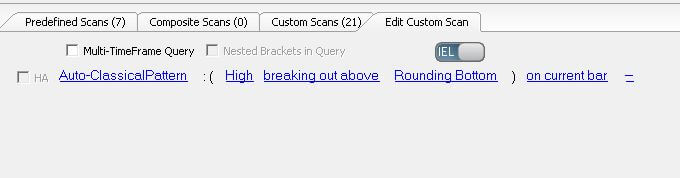
Not only this, but you can also scan for Rounding Bottoms, by creating a simple custom scan in IEL (Investar Easy Language) as follows.
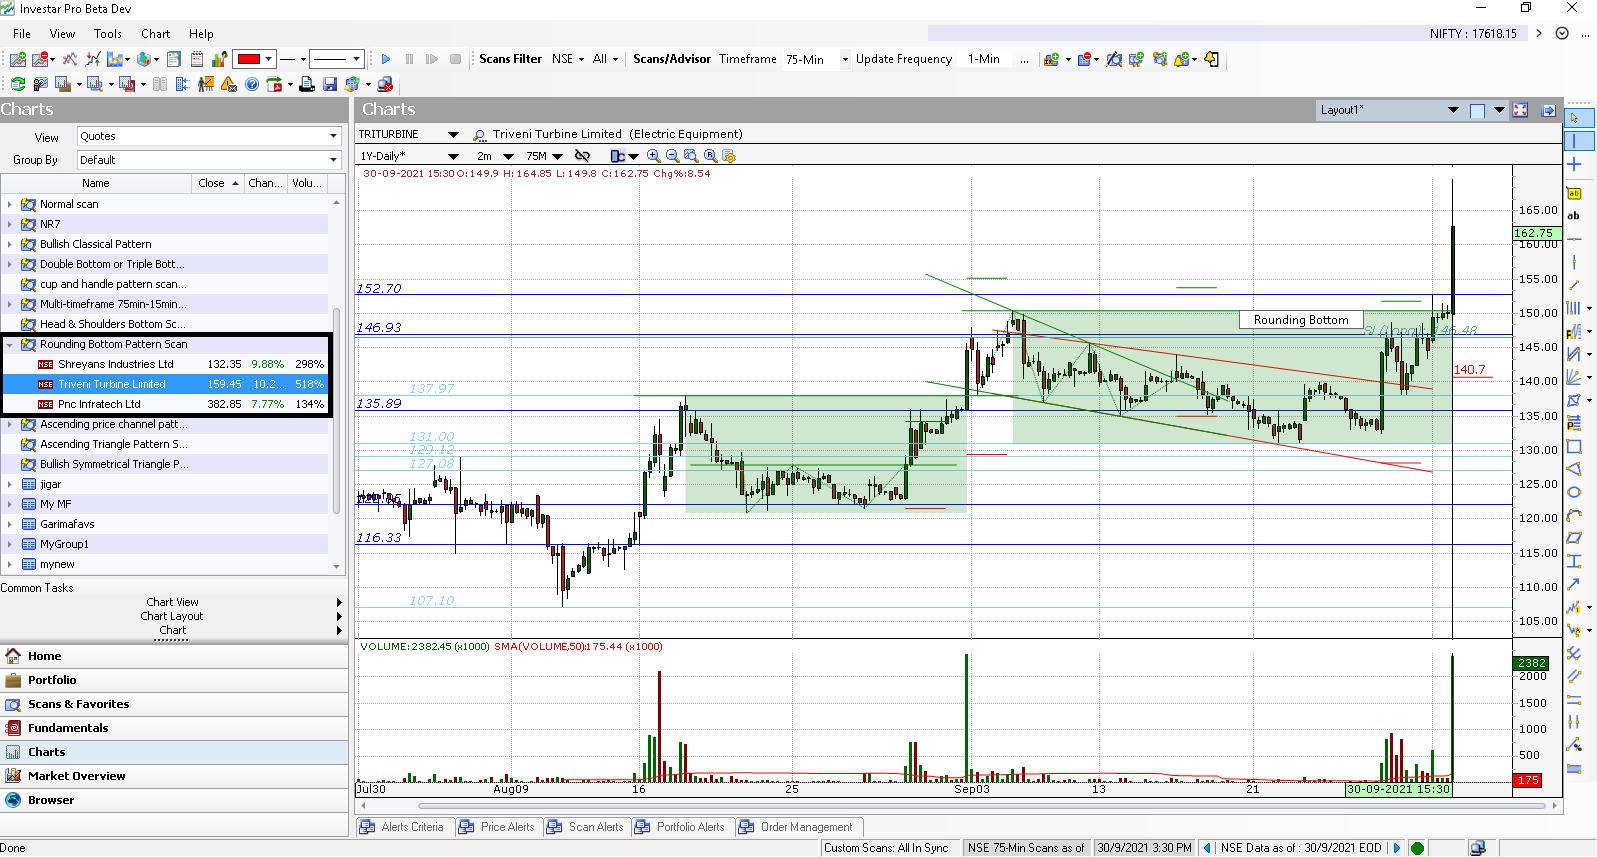
Once you have created the custom scan, it will continuously scan for Rounding Bottoms as the market goes on in the timeframes of your choosing and the results are shown as below.
Just like a Rounding Bottom Pattern is a bullish reversal pattern, a Rounding Top is a bearish reversal pattern which is shaped like a inverse “U”. The rules for combining volume with Rounding Top are also similar to that of Rounding Bottom.
For more details, check out our video on “Auto-Classical Patterns” for an in-depth look into this topic :